Summary and Hands-on with Riptides’ Telemetry Infrastructure
Telemetry isn’t just observability at Riptides — it’s foundational to everything we do. To enforce policy at the source, issue identity from the kernel, and monitor service posture with precision, we’ve built a custom eBPF-based telemetry pipeline that gives us deep, real-time visibility into workload behavior and inter-service communication.
Over the past few weeks, we’ve shared how this foundation was built. If you missed those posts, we recommend starting there, as this entry builds on the concepts introduced earlier. In our first blog post, we explored how to extract events/signals from kernel space, explaining why we chose the tracepoints and how it works. The second blog post focused on streaming events into user space, our rationale for using eBPF, and the key eBPF features powering our approach. Finally, in the third blog post, we showed how to turn kernel tracepoint events into OTEL-compatible telemetry, enriching raw data with user space context to produce actionable insights.
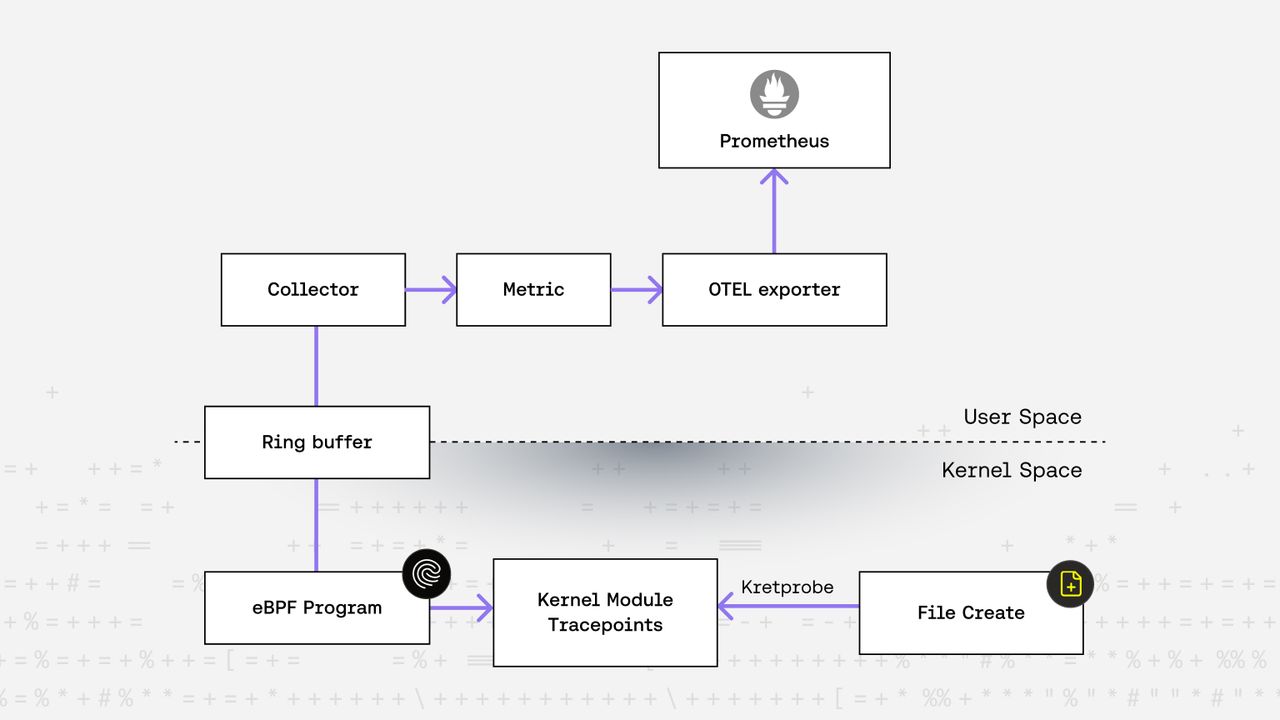
In today’s blog post, we’re introducing a simple open-source project that demonstrates how to transfer enriched kernel tracepoint data using eBPF, OTEL, and Prometheus. The project includes:
- A kernel module that emits a tracepoint event when a file is created.
- eBPF code that uses a ring buffer to transfer the event data to user space.
- A Go application that manages eBPF requirements and initializes OTEL to export the metrics to a Prometheus exporter.
Disclaimer: We’re aware that more advanced eBPF features, such as CO-RE (Compile Once – Run Everywhere), could simplify development and improve portability across kernel versions. However, for the purposes of this demo and to ensure compatibility with a wide range of LTS (Long-Term Support) kernel versions, we intentionally chose a more manual and broadly compatible approach.
Tracing File Creation with a Kernel Module
Example code can be found in this repo.
Deep Dive into Kernel Module Details
To detect file creation events in the kernel, we rely on the do_filp_open system call. Since we don’t want to recompile the kernel to modify this function directly, we can’t insert a tracepoint into its code. Fortunately, as we discussed in our blog posts, we can use kprobes and kretprobes to hook into it. We register a handler function that triggers our custom tracepoint event after each call to do_filp_open.
static struct kretprobe rp = {
    .kp.symbol_name = "do_filp_open",
    .entry_handler = do_filp_open_pre,
    .handler = do_filp_open_ret,
    .data_size = sizeof(struct probe_data),
};
As you can see, we’re using a kretprobe, which is necessary because we need access to the return value of the do_filp_open call to determine whether a file was successfully opened.
First, we define the symbol name where the probe attaches. Then—this is the tricky part—we attach an entry_handler function (which acts like a kprobe). We do this because the information needed to identify a file creation is only available in the function’s input parameters, which are accessible in the entry handler.
The actual tracing happens in the handler function (the return handler), where we retrieve the file name and decide whether to emit the tracepoint event.
Interestingly, both the entry and return handlers receive the same struct pt_regs *regs parameter, which is used to access function arguments like the file name or detect the nature of the operation. However, since this is such a low-level interface, the structure and calling convention can vary between system architectures. To make our implementation at least somewhat portable, we need to manually handle these differences based on the target architecture.
#if defined(CONFIG_ARM64)
    op = (const struct open_flags_partial *)regs->regs[2];
#elif defined(CONFIG_X86_64)
    op = (const struct open_flags_partial *)regs->dx;
These function parameters are determined by the Linux kernel configuration and architecture, so you can rely on compile-time evaluation to select the correct code path for the target system.
However, that’s not the only concern —the signature of do_filp_open may change between kernel versions. That’s why we explicitly state that our implementation has been tested on Linux kernel version 6.11. It might work on other versions, but since we’re accessing low-level memory and kernel internals, there’s a real risk of crashing your system if something changes unexpectedly.
The final member of the kretprobe struct is data_size. This field defines the size of the per-instance data structure (in our case, struct probe_data) that’s used to pass information between the entry and return handlers.
The entry handler checks if the file operation is a file creation and stores that information in the probe_data struct. The return handler then uses that data to decide whether or not to emit the tracepoint event.
Build and Load the Module
If you haven’t already, please clone the repository. This blog assumes you’re using a Mac with Apple Silicon. To run Linux, our tool of choice is lima.
Start by creating and logging into a virtual machine:
limactl start --set '.mounts[0].writable=true' --name ebpf template://ubuntu
limactl shell ebpf
All commands from here onward should be run inside the VM.
First, install the dependencies required to build the kernel module:
# First, we need to install GNU Make, as we have prepared convenient Makefile targets for building and managing the module.
sudo apt install make
make setup
Once the setup is complete, try building and loading the module:
# Build the module
make
# Load the module
make insmod
# Verify the module is loaded
cat /proc/modules | grep filewatcher
Verify the Module is Working
Once the module is loaded, it should register a custom tracepoint in the kernel. To verify this, run:
# Switch to root user
sudo su
# List the registered tracepoint directory
ll /sys/kernel/tracing/events/filewatcher/
If everything is set up correctly, you should see output similar to:
total 0
drwxr-xr-x 1 root root 0 Jul 18 11:26 ./
drwxr-xr-x 1 root root 0 Jan  1  1970 ../
-rw-r----- 1 root root 0 Jul 18 11:26 enable
drwxr-xr-x 1 root root 0 Jul 18 11:26 file_created/
-rw-r----- 1 root root 0 Jul 18 11:26 filter
Before moving on to the eBPF part, let’s test the tracepoint using ftrace. First, enable the tracepoint by writing 1 into the enable file, then use trace_pipe to watch for events:
sudo su
cd /sys/kernel/tracing/
echo 1 > events/filewatcher/enable

# Monitor tracepoint events as they occur
cat trace_pipe
On a separate shell
limactl shell ebpf
touch riptides
If everything is working correctly, you should see output similar to this:
root@lima-ebpf:/sys/kernel/tracing# cat trace_pipe
           touch-6821    [001] d..2.  8711.205770: file_created: /Users/baluchicken/prj/riptidesio/ebpf-tracing-demo/riptides
Here, we used the kernel’s tracing infrastructure, ftrace, to validate that our module is functioning properly.
In short, ftrace is a powerful framework built into the Linux kernel. It offers several built-in tools and high-throughput mechanisms—like ring buffers—to efficiently handle kernel event tracing.
For a deeper dive into ftrace and its internals, check out our first blog post.
Streaming Events from the Kernel to User Space
Now that the kernel module is working, the next step is to stream events to user space using eBPF.
Deep Dive into the eBPF Module
To achieve high-throughput, low-latency communication between the kernel and user space, we use an eBPF ring buffer:
struct
{
    __uint(type, BPF_MAP_TYPE_RINGBUF);
    __uint(max_entries, 65536);
    __type(value, struct file_created_event);
} filewatcher_ringbuf SEC(".maps");
For simplicity, we’ve explicitly defined the value type (struct file_created_event). While this isn’t required, it restricts the buffer to a specific data type. In practice, the ring buffer can store any data structure—as long as it fits within the allocated size—making it flexible for multiple use cases.
SEC("tracepoint/filewatcher/file_created")
int trace_file_created(struct file_created_ctx *ctx)
The familiar SEC macro is used to attach our eBPF handler to the custom tracepoint. In this case, we’re listening to the file_created event under the filewatcher tracepoint.
Inside the handler, we use multiple bpf_printk calls for debugging. These messages can be viewed in the kernel log using dmesg, which helps verify that our eBPF logic is being triggered correctly.
Manually building and loading eBPF programs can be quite involved. To simplify the process, we use Cilium’s eBPF library, which provides a powerful and developer-friendly interface for working with eBPF in Go.
Deep Dive into the eBPF Module Loader/Reader
To generate Go bindings from our eBPF C structs, we use Cilium’s bpf2go tool. It automates the process of compiling eBPF code and generating the corresponding Go types and accessors.
To use it, simply add a //go:generate directive in your Go source file. When you run go generate, bpf2go takes care of compiling the eBPF code and creating Go wrappers.
One of the first steps is to load the generated eBPF objects using the loader:
var objs tracerObjects
err := loadTracerObjects(&objs, nil)
if err != nil {
  log.Fatalf("Error loading ebpf objects: %v", err)
}
defer objs.Close()
Once the eBPF objects are loaded, we can attach the eBPF program to our custom tracepoint:
tp, err := link.Tracepoint("filewatcher", "file_created", objs.TraceFileCreated, nil)Next, we open a reader for the ring buffer to receive data from kernel space:
rb, err := ringbuf.NewReader(objs.FilewatcherRingbuf)
...
rec, err := rb.Read()
...
err = binary.Read(bytes.NewBuffer(rec.RawSample), binary.LittleEndian, &event)
At this point, the data has made its full journey: from a kernel tracepoint, through an eBPF ring buffer, into user space memory.
The final piece of the puzzle is turning these raw events into metrics.
Enriching Raw Events into Metrics with OTEL
To convert raw events into meaningful metrics, we use OpenTelemetry (OTEL) the industry standard for collecting, processing, and exporting telemetry data. OTEL allows you to transform raw events into whatever telemetry format you need. In our case, we’ll expose them as Prometheus counters.
Thanks to OTEL’s rich ecosystem, initializing a Prometheus exporter is simple:
 exporter, err := prometheus.New()
 mp := metricsdk.NewMeterProvider(metricsdk.WithReader(exporter))
 otel.SetMeterProvider(mp)
Next, we define the metric itself. Here, we create a counter named file_created_total and attach custom labels such as path and name:
fileCreatedCounter, err = meter.Int64Counter("file_created_total", metric.WithDescription("Number of files created"))
...
attribute.Key("path").String(path),
attribute.Key("name").String(name),
At this point, everything is wired up:
- Kernel tracepoint triggers on file creation
- eBPF sends the event to user space via a ring buffer
- Go code reads the event, processes it, and emits a labeled metric via OTEL
Now you’re ready to try out the full demo!
To load and run the eBPF module along with the OTEL exporter, simply run:
make run-ebpftracerCheck the Metrics
If everything is working correctly, a metrics server should be running at localhost:8080.
Before querying it, let’s generate some events by creating a file:
touch riptides-demoThen fetch the metrics:
curl localhost:8080/metrics | grep file_createdYou should see an output similar to:
file_created_total{name="riptides-demo",otel_scope_name="filewatcher",otel_scope_schema_url="",otel_scope_version="",path="/Users/baluchicken/prj/riptidesio/ebpf-tracing-demo"} 1This confirms that a tracepoint event was captured by the kernel, passed through eBPF to user space, and successfully transformed into a Prometheus metric via OTEL.
Conclusion
And that’s it—in a nutshell, this is how an event originating in the kernel can be transformed into meaningful, user-consumable telemetry.
We started by writing a simple kernel module that emits a tracepoint event when a file is created. To validate it, we used the kernel’s built-in tracing infrastructure, just as we do when debugging telemetry at Riptides. Next, we built an eBPF program to stream those events into user space. Finally, we used OTEL to enrich the raw data with additional context and export it as Prometheus metrics.
This wraps up our blog series on tracing and telemetry. Throughout the series, we’ve shared how Riptides built its observability stack, and in this final post, we walked through a working example that ties everything together.
We encourage you to explore, tweak, or fork the demo to deepen your understanding of these powerful technologies. Thanks for following along—and see you next time with another exciting topic!
If you enjoyed this post, follow us on LinkedIn and X for more updates. If you'd like to see Riptides in action, get in touch with us for a demo.
Ready to secure your
workloads?
Kernel-level identity and enforcement. No code changes. Deploy in minutes.