Debugging kernel-space memory bugs is one of the most challenging tasks in systems programming. Fortunately, the Linux kernel comes with a rich toolbox of debugging features that can detect memory errors, race conditions, and invalid accesses - long before they cause a crash.
At Riptides, the riptides-driver kernel module plays a central role in our architecture, enabling zero-trust communication and SPIFFE-based process identity. Because of its critical role, the module must be rock solid and free of subtle bugs. In this post, we’re sharing the debugging toolset we use to keep it reliable — and how you can apply the same techniques to your own kernel modules.
In this post, we’ll take a beginner-friendly look at some of the most useful tools built into the Linux kernel for debugging memory issues and concurrency problems. This isn’t meant to be an exhaustive or deeply technical guide, but rather a practical overview that covers the essential, everyday debugging features commonly used by kernel developers.
dyndbg: Dynamic Debug Printing
For decades, printk() (much like printf() in user space) has been the go-to debugging tool for kernel developers. It’s simple, effective, and universally understood - the first thing many developers reach for when troubleshooting.
Benefits of printk():
- Works anywhere in kernel space
- No extra tooling needed
- Easy to trace logic and variable states
Downsides:
- Too much printk() output can flood logs and slow the system
- Can’t be turned off at runtime
- Requires recompilation if you want to add or remove debug output
The dynamic debug framework (dyndbg) is a smarter version of printk() via pr_debug(), allowing you to enable or disable specific debug messages at runtime - without changing your code or rebooting.
How to Use
-
Insert
pr_debug("debug msg");into your module. -
Load your module.
-
Enable debug prints like this:
echo 'module your_module +p' > /sys/kernel/debug/dynamic_debug/control
You can also use wildcards, function names, or file paths for fine-grained control.
Useful for live debugging with minimal impact and easy filtering.
🔍 Kernel Debugging with a debug kernel
Kernel bugs are harder to find and reproduce than user-space bugs. Stack traces are not guaranteed, no graceful exceptions - just a frozen system or a mysterious crash. That’s why we need instrumentation: features baked into the kernel that catch misbehavior before the system breaks. For this guide, we’ll be using Rocky Linux, which conveniently provides pre-built debug kernel packages that are easy to install and use.
Before getting started, we need to install the debug version of the kernel and its matching headers package to enable and build against the debugging features:
sudo dnf install kernel-debug kernel-debug-devel

# Check the current debug kernel version:
CURRENT_DEBUG_KERNEL=$(ls -1 /boot/vmlinuz-*+debug | head -1)

# Set it as the default at boot:
sudo grubby --set-default ${CURRENT_DEBUG_KERNEL}

# Enable debug features at boot time, see details later:
sudo grubby --update-kernel=${CURRENT_DEBUG_KERNEL} --args "kmemleak=on kasan=on kasan.multi_shot=1"

# We need to reboot into the debug kernel now
sudo reboot
Then boot into it. These kernels enable key debug configs like CONFIG_KASAN, CONFIG_KFENCE, and CONFIG_LOCKDEP that are compiled into this debug kernel.
KASAN: Kernel Address Sanitizer
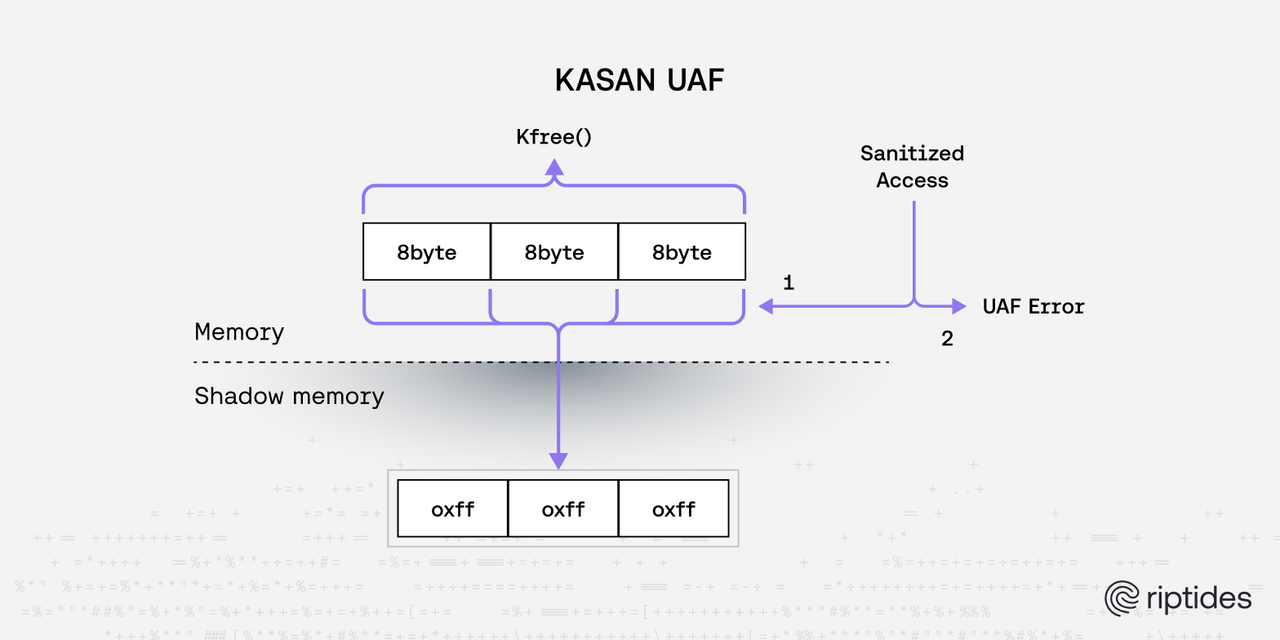
KASAN (Kernel Address Sanitizer) is one of the most powerful memory debugging tools available in the Linux kernel. It works by maintaining a “shadow map” - a parallel memory region that tracks the state of every byte in kernel memory. For every 8 bytes of kernel memory, KASAN uses 1 byte of shadow memory to record whether that memory is valid, poisoned, or freed.
When your kernel module performs any memory access (read or write), KASAN automatically checks the shadow map to verify that the access is legitimate. This happens transparently without any changes to your code. If KASAN detects an invalid access, it immediately triggers a kernel panic with a detailed report showing exactly what went wrong, where it happened, and the complete call stack that led to the violation.
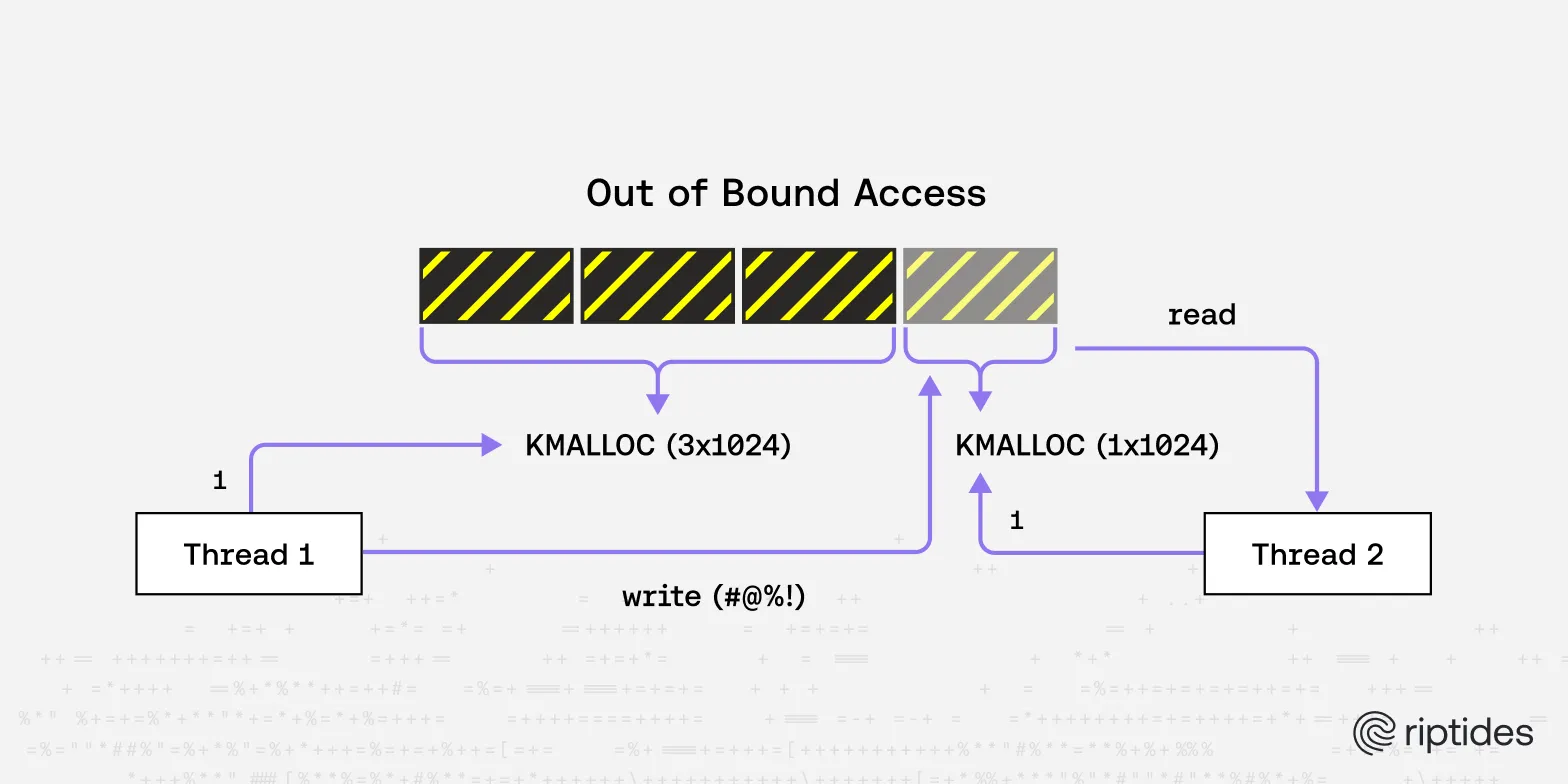
KASAN excels at catching three critical classes of memory bugs: use-after-free errors (accessing memory that has already been freed), buffer overflows (writing past the end of an allocated region), and invalid pointer dereferences (accessing uninitialized or corrupted pointers). These bugs are notoriously difficult to debug because they often don’t cause immediate crashes - instead, they silently corrupt memory and cause mysterious failures much later.
The shadow memory approach makes KASAN extremely thorough but also relatively expensive in terms of memory overhead (roughly 12.5% additional RAM usage). This makes it ideal for development and testing environments where you want to catch every possible memory error, but less suitable for production systems.
Enable KASAN at boot time:
kasan=1When KASAN detects a violation, detailed output will immediately appear in dmesg with stack traces showing both the violating code and the allocation/deallocation history. This makes it invaluable during fuzzing, stress testing, or any scenario where you’re trying to trigger edge cases in your kernel module.
Example: KASAN Catching an Out-of-Bounds Write
Here’s a simple example of buggy kernel module code that KASAN would immediately catch:
static void __out_of_bounds(int num_bytes)
{
    char *buffer = kmalloc(num_bytes, GFP_KERNEL);

    // This writes past the end of our num_bytes-byte allocation!
    strcpy(buffer, "This string is definitely longer than %d bytes", num_bytes);

    kfree(buffer);
}
Without KASAN, this bug might silently corrupt adjacent memory and cause mysterious crashes elsewhere in the kernel. With KASAN enabled, you’d immediately see output like this in dmesg:
[Tue Aug  5 12:00:30 2025] ==================================================================
[Tue Aug  5 12:00:30 2025] BUG: KASAN: slab-out-of-bounds in debug_zoo_init+0x224/0x1000 [debug_zoo]
[Tue Aug  5 12:00:30 2025] Write of size 47 at addr ffff0000e5f5cc40 by task insmod/5228

[Tue Aug  5 12:00:30 2025] CPU: 2 PID: 5228 Comm: insmod Kdump: loaded Tainted: G           OE     -------  ---  5.14.0-503.40.1.el9_5.aarch64+debug #1
[Tue Aug  5 12:00:30 2025] Hardware name: Apple Inc. Apple Virtualization Generic Platform, BIOS 2075.120.2.0.0 04/18/2025
[Tue Aug  5 12:00:30 2025] Call trace:
[Tue Aug  5 12:00:30 2025]  dump_backtrace+0xac/0x130
[Tue Aug  5 12:00:30 2025]  show_stack+0x1c/0x30
[Tue Aug  5 12:00:30 2025]  dump_stack_lvl+0xac/0xe8
[Tue Aug  5 12:00:30 2025]  print_address_description.constprop.0+0x84/0x2e8
[Tue Aug  5 12:00:30 2025]  print_report+0x100/0x1e4
[Tue Aug  5 12:00:30 2025]  kasan_report+0x80/0xbc
[Tue Aug  5 12:00:30 2025]  kasan_check_range+0xe4/0x190
[Tue Aug  5 12:00:30 2025]  memcpy+0x54/0x90
[Tue Aug  5 12:00:30 2025]  debug_zoo_init+0x224/0x1000 [debug_zoo]
This detailed report shows exactly where the violation occurred, what type of access it was, and the complete allocation history - making the bug trivial to fix.
KFENCE: Kernel Electric Fence
KFENCE (Kernel Electric Fence) takes a fundamentally different approach to memory debugging compared to KASAN. While KASAN checks every single memory access with significant overhead, KFENCE uses a sampling-based strategy that makes it suitable even for production environments.
The core idea behind KFENCE is elegantly simple: instead of tracking all allocations, it randomly selects a small percentage of kmalloc() calls and places each selected allocation on its own dedicated memory page, surrounded by guard pages. These guard pages are marked as non-accessible in the page tables, so any attempt to read or write beyond the allocated object immediately triggers a page fault.
When a page fault occurs on a guard page, KFENCE knows exactly what happened: either an out-of-bounds access (reading/writing past the end of the allocation) or a use-after-free (accessing memory that was previously freed). The page fault handler generates a detailed report showing the violating instruction, call stack, and allocation history.
This sampling approach means KFENCE has very low overhead (typically less than 1% performance impact) since it only tracks a tiny fraction of allocations. However, it’s probabilistic - it might miss bugs that happen in allocations that weren’t selected for monitoring. The trade-off is worth it for production systems where you need some level of memory error detection without the heavy overhead of KASAN.
KFENCE is particularly effective at catching temporal bugs (use-after-free) because it never actually returns freed memory to the allocator - instead, it keeps the guard pages in place indefinitely, ensuring that any future access to freed KFENCE-monitored memory will immediately fault.
Enable KFENCE with a sampling interval in milliseconds (lower numbers = more frequent sampling):
kfence.sample_interval=100Note: Unlike KASAN which requires a debug kernel, KFENCE is available in most standard kernel builds (including production kernels) since it has minimal overhead. You can enable it on your normal kernel without needing to install kernel-debug:
# For a standard kernel, just add KFENCE parameters:
sudo grubby --update-kernel=ALL --args "kfence.sample_interval=100"
sudo reboot
This makes KFENCE particularly valuable for production debugging scenarios where installing a debug kernel isn’t practical.
Example: KFENCE Catching a Use-After-Free
Here’s an example of a use-after-free bug that KFENCE would catch:
static void __use_after_free(void)
{
    char *leak = kzalloc(100, GFP_KERNEL);
    if (!leak)
    {
        printk(KERN_ERR "Memory allocation failed\n");
        return;
    }
    strcpy(leak, "This is a use-after-free example");
    kfree(leak);
    // Using the pointer after freeing it, which is undefined behavior
    printk(KERN_INFO "Using freed memory: %s\n", leak); // This is dangerous!
}
If this allocation was selected by KFENCE’s sampling, you’d see output like:
[Tue Aug  5 15:58:32 2025] ==================================================================
[Tue Aug  5 15:58:32 2025] BUG: KFENCE: use-after-free read in string+0x50/0x100

[Tue Aug  5 15:58:32 2025] Use-after-free read at 0x00000000383f6e38 (in kfence-#121):
[Tue Aug  5 15:58:32 2025]  string+0x50/0x100
[Tue Aug  5 15:58:32 2025]  vsnprintf+0x190/0x780
[Tue Aug  5 15:58:32 2025]  vprintk_store+0xfc/0x4d0
[Tue Aug  5 15:58:32 2025]  vprintk_emit+0x11c/0x3cc
[Tue Aug  5 15:58:32 2025]  vprintk_default+0x3c/0x44
[Tue Aug  5 15:58:32 2025]  vprintk+0xc8/0x110
[Tue Aug  5 15:58:32 2025]  _printk+0x64/0x8c
[Tue Aug  5 15:58:32 2025]  debug_zoo_init+0x128/0x1000 [debug_zoo]
[Tue Aug  5 15:58:32 2025]  do_one_initcall+0x4c/0x2e0
[Tue Aug  5 15:58:32 2025]  do_init_module+0x5c/0x220
...

[Tue Aug  5 15:58:32 2025] kfence-#121: 0x00000000383f6e38-0x00000000c727eacc, size=100, cache=kmalloc-128

[Tue Aug  5 15:58:32 2025] allocated by task 5364 on cpu 0 at 51.206043s:
[Tue Aug  5 15:58:32 2025]  kmalloc_trace+0x228/0x270
[Tue Aug  5 15:58:32 2025]  debug_zoo_init+0xe8/0x1000 [debug_zoo]
[Tue Aug  5 15:58:32 2025]  do_one_initcall+0x4c/0x2e0
[Tue Aug  5 15:58:32 2025]  do_init_module+0x5c/0x220
...

[Tue Aug  5 15:58:32 2025] freed by task 5364 on cpu 0 at 51.206047s:
[Tue Aug  5 15:58:32 2025]  debug_zoo_init+0x11c/0x1000 [debug_zoo]
[Tue Aug  5 15:58:32 2025]  do_one_initcall+0x4c/0x2e0
[Tue Aug  5 15:58:32 2025]  do_init_module+0x5c/0x220
...

[Tue Aug  5 15:58:32 2025] CPU: 0 PID: 5364 Comm: insmod Kdump: loaded Tainted: G    B      OE     -------  ---  5.14.0-570.30.1.el9_6.aarch64 #1
[Tue Aug  5 15:58:32 2025] Hardware name: Apple Inc. Apple Virtualization Generic Platform, BIOS 2075.120.2.0.0 04/18/2025
[Tue Aug  5 15:58:32 2025] ==================================================================
Use KFENCE in long-running systems where reproducibility is hard but correctness is critical, or in production environments where you want some memory error detection without KASAN’s overhead.
kmemleak: Memory Leak Detector
kmemleak is the kernel’s equivalent of valgrind for user-space memory leak detection. It works by tracking all kernel memory allocations (via kmalloc(), kzalloc(), vmalloc(), etc.) and periodically scanning all kernel memory to find allocations that are no longer reachable from any pointer.
The core principle is simple but powerful: kmemleak maintains a database of all active allocations along with their call stacks. During a scan, it treats all kernel data structures, CPU registers, and stack memory as potential “roots” and performs a mark-and-sweep garbage collection algorithm. Any allocation that can’t be reached by following pointer chains from these roots is considered a leaked object.
What makes kmemleak particularly valuable is that it catches logical leaks - memory that’s technically still allocated but no longer accessible by your code because you’ve lost all references to it. These bugs are often subtle: a function returns early due to an error condition, forgetting to free memory it allocated, or a data structure is partially cleaned up but leaves some allocations dangling.
Unlike KASAN and KFENCE which detect violations immediately when they occur, kmemleak is passive - it only reports leaks when you explicitly trigger a scan. This makes it ideal for regression testing and periodic health checks of long-running systems.
kmemleak tracks several important pieces of information for each allocation:
- Size and address of the allocated memory
- Complete call stack showing where the allocation occurred
- Timestamp of when the allocation was made
- References from other kernel objects
Enable kmemleak at boot time:
kmemleak=onThen trigger scans manually to check for leaks:
echo scan > /sys/kernel/debug/kmemleak
cat /sys/kernel/debug/kmemleak # you can use tail -f as well for continous observing
Example: kmemleak Catching a Memory Leak
Here’s an example of a memory leak that kmemleak would detect:
static void __leak(void)
{
    char *leak = kmalloc(100, GFP_KERNEL);
    if (!leak)
    {
        printk(KERN_ERR "Memory allocation failed\n");
        return;
    }
    strcpy(leak, "This is a memory leak example");

    printk(KERN_INFO "Memory leak example: allocated %p and now leaking\n", leak);
}
After loading this module and triggering a kmemleak scan, you’d see in the dmesg logs:
[Wed Aug  6 10:26:26 2025] Here comes the Debug Zoo!
[Wed Aug  6 10:26:26 2025] Use 'dmesg' to see the debug messages.
[Wed Aug  6 10:26:26 2025] Memory leak example: allocated 00000000bd22923f and now leaking
[Wed Aug  6 10:28:56 2025] kmemleak: 1 new suspected memory leaks (see /sys/kernel/debug/kmemleak)
And in /sys/kernel/debug/kmemleak you will find something like:
unreferenced object 0xffff00012968a800 (size 128):
  comm "insmod", pid 2287, jiffies 4294954674
  hex dump (first 32 bytes):
    54 68 69 73 20 69 73 20 61 20 6d 65 6d 6f 72 79  This is a memory
    20 6c 65 61 6b 20 65 78 61 6d 70 6c 65 00 00 00   leak example...
  backtrace (crc 54832baf):
    kmemleak_alloc+0xb4/0xc4
    kmalloc_trace+0x268/0x340
    debug_zoo_init+0x11c/0x1000
    do_one_initcall+0x178/0xad0
    do_init_module+0x1dc/0x660
    load_module+0x1034/0x1600
This report shows the leaked object’s address, size, age, and complete allocation call stack, making it easy to track down where the leak originated.
Pro tip: To improve stack trace quality and make debugging easier, compile your modules with debug information:
ccflags-y += -g -fno-omit-frame-pointer -fno-optimize-sibling-callskmemleak is particularly useful for:
- Regression testing - run scans before and after code changes
- Long-running system health checks - periodic scans on development systems
- Error path validation - ensuring cleanup code properly handles all allocations
Lockdep: Deadlock & Lock Order Validator
Lockdep is the kernel’s sophisticated deadlock detection and lock validation system. It’s designed to catch one of the most insidious classes of kernel bugs: deadlocks and lock ordering violations that can cause the entire system to freeze.
The fundamental problem Lockdep solves is detecting potential deadlocks before they actually occur. A classic deadlock scenario happens when:
- Thread A holds lock X and tries to acquire lock Y
- Thread B holds lock Y and tries to acquire lock X
- Both threads wait forever for each other
But Lockdep goes beyond just detecting active deadlocks - it builds a dependency graph of all lock acquisitions throughout the system’s runtime and analyzes this graph to detect scenarios that could lead to deadlocks, even if they haven’t happened yet.
How Lockdep Works:
Lockdep monitors every spin_lock(), mutex_lock(), read_lock(), etc. call and builds a directed graph of lock dependencies. If thread A acquires lock X then lock Y, Lockdep records the dependency X → Y. Later, if it sees another code path trying to acquire Y → X, it immediately flags this as a potential deadlock because these two paths could execute simultaneously and deadlock.
What makes Lockdep particularly powerful is its ability to catch lock inversion bugs across completely different code paths that might rarely execute at the same time. A bug might exist for years without manifesting until exactly the right timing conditions occur.
Lockdep also validates other locking correctness properties:
- Lock class consistency - ensuring the same lock is always used with the same semantic rules
- IRQ safety - detecting when code that can run in interrupt context tries to acquire locks held in non-interrupt context
- Recursive locking - catching attempts to acquire the same lock twice
Performance Impact: Lockdep has significant overhead (~20-30% performance impact) and uses substantial memory to track the dependency graph, so it’s only enabled in debug kernels and should never be used in production.
Enable Lockdep at boot time:
lockdep=1Alternatively, if you’re already running a debug kernel, Lockdep is usually enabled by default through the CONFIG_PROVE_LOCKING kernel configuration option.
Example: Lockdep Catching a Lock Ordering Bug
Here’s an example of problematic locking that Lockdep would catch:
static struct task_struct *lock_thread1;
static struct task_struct *lock_thread2;

static DEFINE_MUTEX(lock_a);
static DEFINE_MUTEX(lock_b);

static int lock_thread_fn1(void *data)
{
    mutex_lock(&lock_a);
    msleep(100);
    mutex_lock(&lock_b); // A -> B
    msleep(100);

    mutex_unlock(&lock_b);
    mutex_unlock(&lock_a);

    return 0;
}

static int lock_thread_fn2(void *data)
{
    msleep(50); // Ensure interleaving
    mutex_lock(&lock_b);
    msleep(100);
    mutex_lock(&lock_a); // B -> A -> should trigger lockdep

    mutex_unlock(&lock_a);
    mutex_unlock(&lock_b);

    return 0;
}

static void __lockdep(void)
{
    printk(KERN_INFO "lockdep test loaded\n");

    lock_thread1 = kthread_run(lock_thread_fn1, NULL, "lock_thread1");
    lock_thread2 = kthread_run(lock_thread_fn2, NULL, "lock_thread2");
}
When Lockdep detects this lock ordering violation, you’d see detailed output in dmesg:
[Wed Aug  6 10:55:13 2025] Debug Zoo module unloaded
[Wed Aug  6 10:55:17 2025] Here comes the Debug Zoo!
[Wed Aug  6 10:55:17 2025] Use 'dmesg' to see the debug messages.
[Wed Aug  6 10:55:17 2025] lockdep test loaded

[Wed Aug  6 10:55:17 2025] ======================================================
[Wed Aug  6 10:55:17 2025] WARNING: possible circular locking dependency detected
[Wed Aug  6 10:55:17 2025] 5.14.0-570.30.1.el9_6.aarch64+debug #1 Tainted: G           OE     -------  ---
[Wed Aug  6 10:55:17 2025] ------------------------------------------------------
[Wed Aug  6 10:55:17 2025] lock_thread2/3005 is trying to acquire lock:
[Wed Aug  6 10:55:17 2025] ffff8000096e3168 (lock_a){+.+.}-{3:3}, at: lock_thread_fn2+0x48/0x70 [debug_zoo]
[Wed Aug  6 10:55:17 2025]
                           but task is already holding lock:
[Wed Aug  6 10:55:17 2025] ffff8000096e30a8 (lock_b){+.+.}-{3:3}, at: lock_thread_fn2+0x30/0x70 [debug_zoo]
[Wed Aug  6 10:55:17 2025]
                           which lock already depends on the new lock.


                           other info that might help us debug this:

[Wed Aug  6 10:55:17 2025]  Possible unsafe locking scenario:

[Wed Aug  6 10:55:17 2025]        CPU0                    CPU1
[Wed Aug  6 10:55:17 2025]        ----                    ----
[Wed Aug  6 10:55:17 2025]   lock(lock_b);
[Wed Aug  6 10:55:17 2025]                                lock(lock_a);
[Wed Aug  6 10:55:17 2025]                                lock(lock_b);
[Wed Aug  6 10:55:17 2025]   lock(lock_a);
[Wed Aug  6 10:55:17 2025]
                            *** DEADLOCK ***

[Wed Aug  6 10:55:17 2025] 1 lock held by lock_thread2/3005:
[Wed Aug  6 10:55:17 2025]  #0: ffff8000096e30a8 (lock_b){+.+.}-{3:3}, at: lock_thread_fn2+0x30/0x70 [debug_zoo]
When to use Lockdep:
- During development and testing of any code that uses kernel locks
- When debugging mysterious hangs or performance issues
- For validating complex locking hierarchies in subsystems
- Before submitting kernel patches that modify locking behavior
Pro tip: Lockdep catches bugs that might take months or years to manifest in real systems. Always test your kernel modules with Lockdep enabled during development.
Testing Your Module (The Right Way)
Our approach at Riptides: We run a layered debugging strategy for the riptides-driver module. During active development, we test on debug kernels with the full suite enabled (KASAN + kmemleak + Lockdep) to catch every possible issue. For daily development on normal kernels, we keep KFENCE enabled as a lightweight background monitor, but skip Lockdep due to its performance overhead. This ensures that memory corruption bugs are caught immediately during code changes, while locking violations are caught during our periodic debug kernel testing sessions. We compile and run our test cases in CI on debug kernels as well and monitor kmemleak and dmesg for errors.
It’s tempting to write a module, load it, see no crash, and assume it’s fine. Don’t.
- Test unhappy paths: failed allocations, edge values, misuse.
- Intentionally leak memory or trigger races to ensure your module behaves.
- Avoid relying only on printk debugging; use tracepoints and structured logging.
Robust modules survive chaos - not just ideal conditions, don’t forget to test beyond the happy path. All the examples are available on GitHub.
Resources
If you enjoyed this post, follow us on LinkedIn and X for more updates. If you'd like to see Riptides in action, get in touch with us for a demo.
Ready to secure your
workloads?
Kernel-level identity and enforcement. No code changes. Deploy in minutes.